Working with output
Utilities
Several simply utilities exist to operate on output files
compare.py:this script takes two plot files and compares them zone-by-zone and reports the differences. This is useful for testing, to see if code changes affect the solution. Many problems have stored benchmarks in their solver’s tests directory. For example, to compare the current results for the incompressible shear problem to the stored benchmark, we would do:./compare.py shear_128_0216.pyro incompressible/tests/shear_128_0216.pyro
Differences on the order of machine precision may arise because of optimizations and compiler differences across platforms. Students should familiarize themselves with the details of how computers store numbers (floating point). An excellent read is What every computer scientist should know about floating-point arithmetic by D. Goldberg.
plot.py: this script uses the solver’sdovis()routine to plot an output file. For example, to plot the data in the fileshear_128_0216.pyrofrom the incompressible shear problem, you would do:./plot.py -o image.png shear_128_0216.pyro
where the
-ooption allows you to specify the output file name.
Reading and plotting manually
pyro output data can be read using the util.io.read method. The following
sequence (done in a python session) reads in stored data (from the
compressible Sedov problem) and plots data falling on a line in the x
direction through the y-center of the domain (note: this will include
the ghost cells).
import matplotlib.pyplot as plt
import util.io as io
sim = io.read("sedov_unsplit_0000.h5")
dens = sim.cc_data.get_var("density")
plt.plot(dens.g.x, dens[:,dens.g.ny//2])
plt.show()
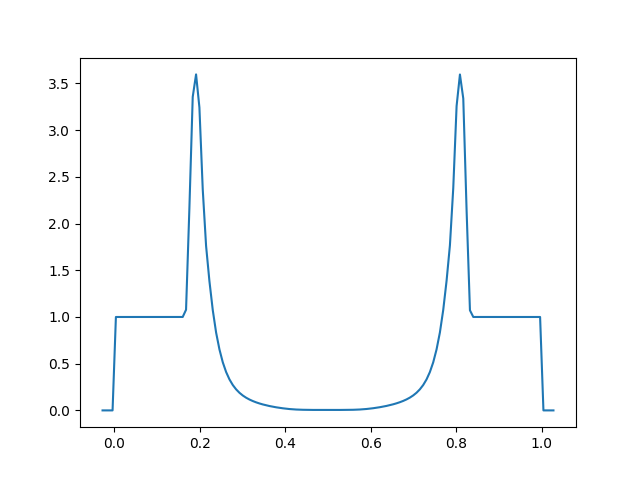
Note: this includes the ghost cells, by default, seen as the small regions of zeros on the left and right.